


SAP performance testing gets confused with two other things it isn’t. It isn’t functional testing, checking whether a transaction produces the right output. And it isn’t regression testing, checking whether a change broke something that used to work. Performance testing asks a different question: does the system hold up when real transaction volumes, real user counts, and real data loads hit it at once.
That distinction matters because SAP landscapes fail in ways that functional tests never catch. A goods receipt posting might work perfectly for one tester clicking through it. The same transaction can time out when 200 warehouse staff run it simultaneously during a month-end close. Functional testing would never surface that. Performance testing exists to find it before your users do.
The four types of SAP performance testing
Performance testing isn’t one test. It’s four distinct tests, each answering a different question about how your SAP landscape behaves under pressure.
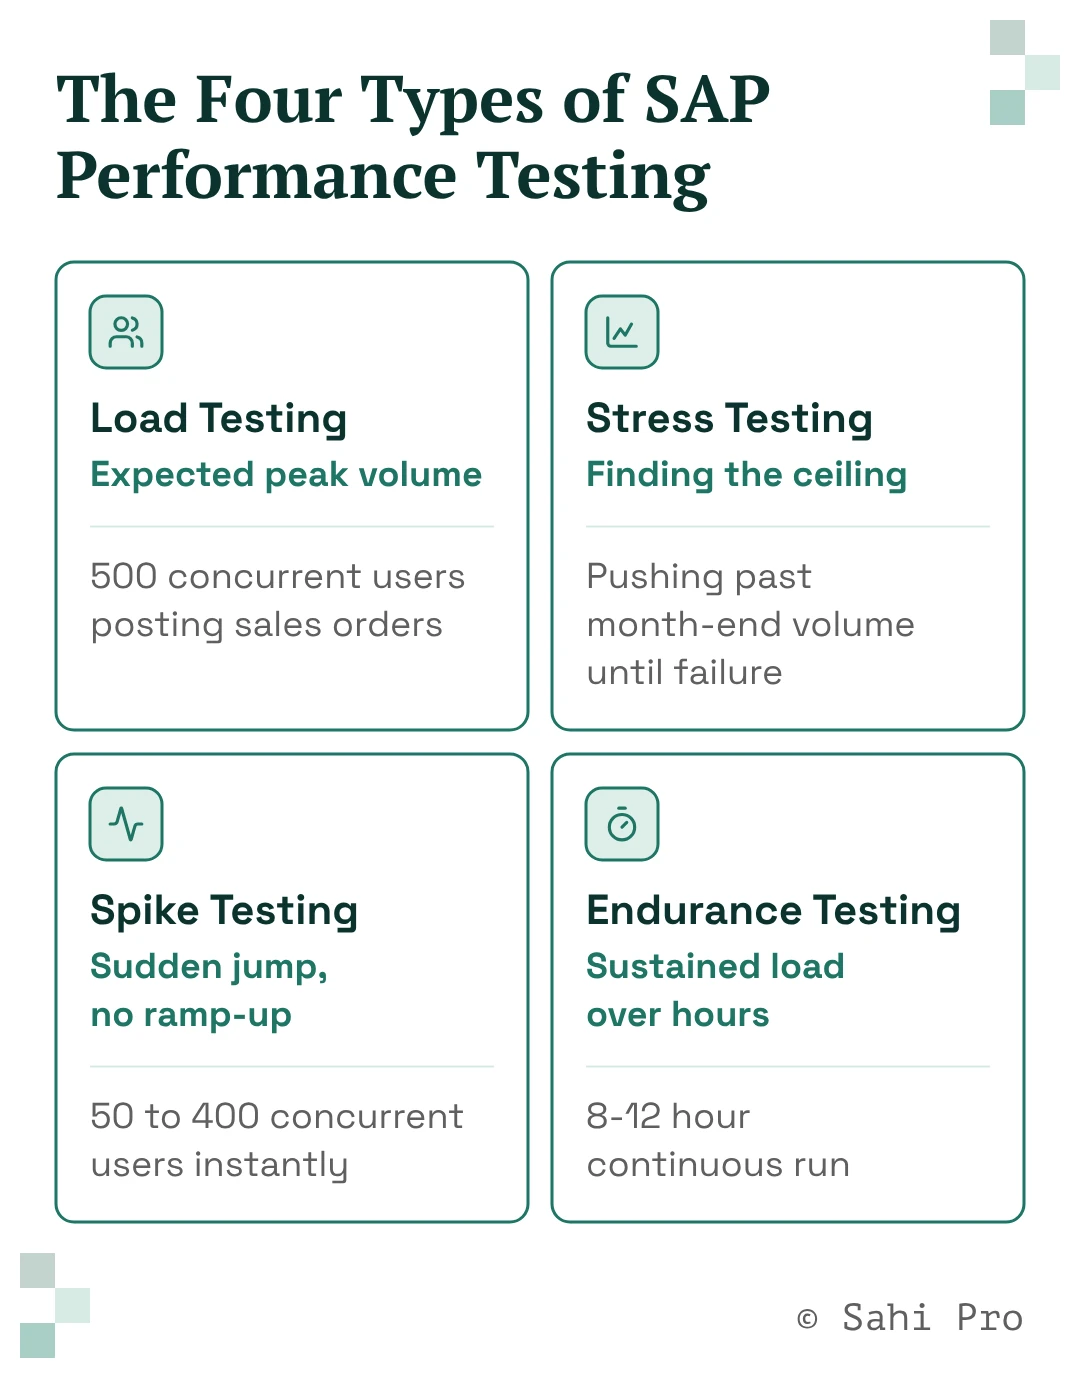
- Load testing. Can the system handle expected peak volume without slowing down? This is the baseline test every SAP shop should run before a go-live or a major release. Example: simulating 500 concurrent users posting sales orders during a typical business day.
- Stress testing. What happens when volume exceeds expected peak, and where does the system actually break? This finds your ceiling, not your comfort zone. Example: pushing concurrent users well past your normal month-end volume until response times degrade or the system fails outright.
- Spike testing. Can the system absorb a sudden, sharp jump in load rather than a gradual ramp-up? SAP environments see this constantly around fiscal year-end, promotional sales events, or when a new plant goes live on an existing instance. Example: simulating an instant jump from 50 to 400 concurrent users with no warm-up period.
- Endurance testing. Does performance hold steady over hours, not just minutes? Memory leaks, connection pool exhaustion, and database bloat often show up only after sustained runtime. Example: running a moderate, steady transaction load continuously for 8 to 12 hours and watching for gradual degradation.
Most teams run load testing and stop there. That leaves stress limits, spike resilience, and long-run stability completely untested, which is exactly where a lot of production incidents originate.
Where these tests actually matter in SAP
Generic performance testing advice treats every application the same way. SAP doesn’t work like every application. Here’s where each testing type maps to something specific in an SAP landscape.
- HANA database performance under load. SAP HANA is fast, but it’s not infinite. Complex reporting queries, large batch jobs, and heavy concurrent OLTP traffic can all compete for the same in-memory resources. Load and stress testing against HANA-backed transactions is how you find contention before your users do.
- Fiori and OData scalability. Fiori apps run on OData services that sit between the UI and the backend. Each additional concurrent Fiori user adds OData calls, and that layer can become a bottleneck well before the backend database does. This is a common gap because teams performance-test the ABAP backend and skip the OData layer entirely.
- Custom ABAP code. Standard SAP code is heavily optimized after two decades of enterprise use. Custom developments, enhancements, and Z-programs usually aren’t held to the same standard. A poorly written custom report or a badly indexed custom table can single-handedly drag down an otherwise healthy system under load.
- Month-end and period-end closing. This is the recurring peak-volume event every SAP finance and controlling team already knows and dreads. Closing activities compress a month’s worth of postings, allocations, and reports into a few days, sometimes a few hours. It’s a naturally occurring stress test, which makes it one of the best real-world scenarios to model deliberately rather than discover the hard way.
SAP’s own tooling: ST03 and ST03N
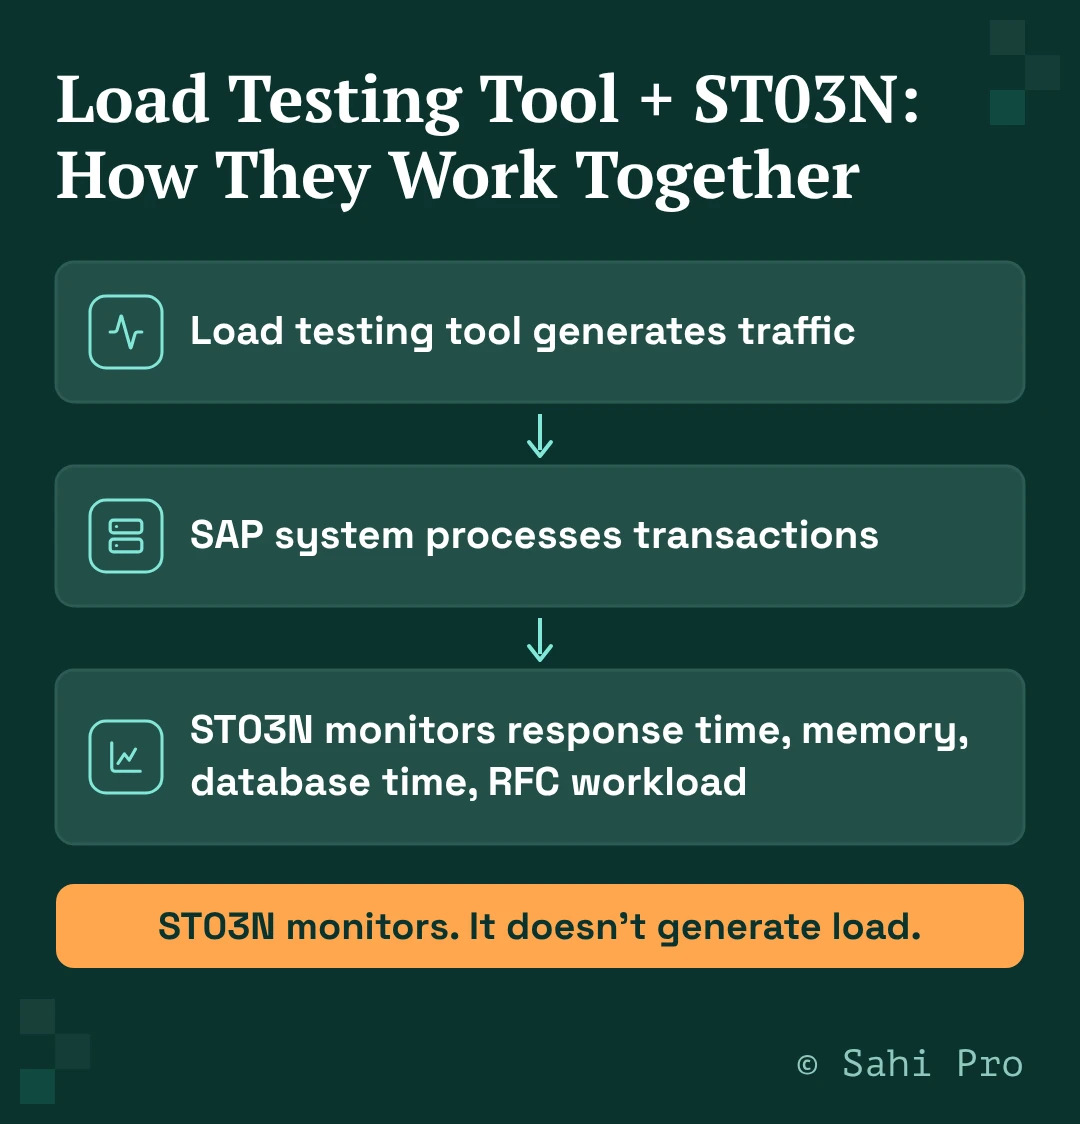
SAP ships a native workload monitor, transaction codes ST03 and ST03N, that gives you visibility into how the system is actually performing. According to SAP’s ST03N Workload Monitor documentation, the tool analyzes statistical data from the R/3 kernel to display response time distribution across dialog steps, workload broken down by transaction, program, and application, memory consumption, database time, RFC (remote function call) workload, user activity, and spool request volume.
This is worth being precise about. ST03/ST03N is a monitoring tool, not a load-generation tool. It tells you how the system responded during a period of activity. It doesn’t create that activity for you. Dedicated performance testing tools generate the synthetic load. ST03/ST03N is where you go to read what happened to the system while that load was running, or during a real production peak like month-end close.
Used together, that’s the right pairing. Generate representative load with a performance testing tool, then use ST03/ST03N to see exactly where the system spent its time and where it struggled. Teams that skip the monitoring half often run a load test, see a slow response time, and have no way to tell whether the bottleneck was the database, a custom report, or network latency.
Common bottlenecks worth testing for
A few patterns show up repeatedly in SAP performance work, regardless of industry:
- Batch jobs scheduled without regard for peak online transaction windows, competing for the same database resources.
- Custom Z-tables missing proper indexes, turning a fast standard transaction into a slow custom variant.
- RFC-heavy integrations to external systems that weren’t sized for current transaction volume.
- Fiori launchpad and OData timeouts under concurrent user load that never show up in single-user testing.
- Print and spool request backlogs during high-volume periods like invoice runs or month-end reporting.
None of these show up in a functional test. All of them show up in a properly designed load or stress test.
Where Sahi Pro fits
Sahi Pro isn’t a load-generation tool, and it doesn’t claim to be. Its engine is built for functional test automation across web, desktop, mobile, SAP, and API, in a single continuous flow. Performance testing and functional automation solve different problems, and conflating them does a disservice to both. If you’re evaluating dedicated tools for the load-generation side, our SAP automation tools guide covers how to choose one.
Here’s where the two intersect in practice. When you run a load or stress test against an SAP landscape, you’re not just watching response times. You need to confirm the system is still functionally correct under that load, not just fast or slow. A transaction that returns in 2 seconds but posts the wrong value under concurrent load is a worse outcome than a transaction that’s simply slow.
That’s the piece Sahi Pro’s cross-technology automation supports well: running the same functional validation scripts that verify correct posting behavior, correct data flow, and correct outcomes across SAP GUI, Fiori, and any connected web or desktop systems, so a performance test run can be checked for functional accuracy alongside its speed. Because Sahi Pro’s relational element identification keeps scripts stable through UI changes, those same functional checks keep working release after release, rather than needing to be rebuilt every time SAP patches Fiori or updates a transaction screen.
Ready to see how Sahi Pro keeps functional validation stable across your SAP landscape, even while performance testing pushes it to its limits? Book a demo and see it on your own environment.
Sources
- SAP help.sap.com: Workload Monitor documentation (verified via direct fetch. Primary source for monitor capabilities: analyzes statistical data from the R/3 kernel to show response time distribution, workload by transaction/program/application, memory consumption, database time, RFC workload, user activity, spool requests)
- TestGrid: SAP performance testing article (four testing types: load, stress, spike, endurance. SAP-specific testable areas referenced for context, not quoted verbatim)
- BlazeMeter: SAP performance testing article (test data volume and test environment cost as recurring challenges. ST03 mentioned as SAP’s own tool, corroborating the SAP-owned source)
- Tricentis “SAP Enterprise Performance Testing” page, reviewed as competitor content, confirmed to be duplicated marketing copy across multiple country sap.com subdomains, not cited as a factual source