


Why a passing regression suite and a production incident from the same week are not a contradiction, if the suite was only ever testing the web layer
TL;DR
- PLM applications like Teamcenter and Windchill split functionality across a web portal, a Java thick client, and backend API integrations.
- Selenium’s WebDriver protocol only sees the DOM. It has no visibility into Java Swing/AWT/SWT components or canvas-painted CAD plugin windows.
- A Selenium suite can report a 95% pass rate and still miss the exact layer where your last production defect actually happened.
- This is a structural coverage gap, not a sign that your Selenium suite or your QA team is doing bad work.
- Mapping your last several production defects to the layer they occurred in is the fastest way to find out if this gap exists in your environment.
Where PLM applications actually live outside the browser
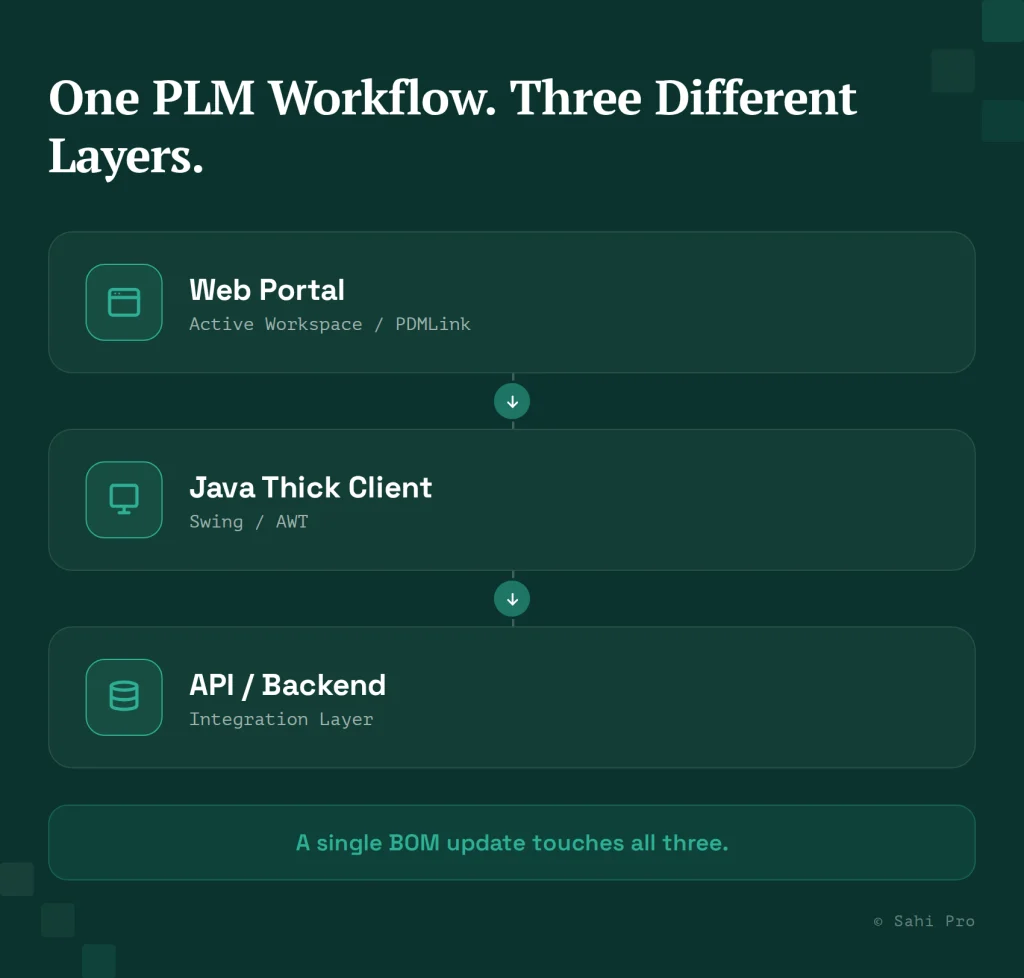
A Teamcenter or Windchill implementation is rarely just a website. Siemens Teamcenter runs its modern interface through Active Workspace, a web application, but BOM management, structure editing, and several administrative functions still route through a Java Rich Client built on Swing and AWT. PTC Windchill follows a similar split: PDMLink runs as a web portal, but attribute grids render on canvas rather than as standard HTML elements, and CAD authoring flows through embedded Creo plugin windows that open as their own process, not as part of the browser’s DOM tree.
Take a routine BOM update. A user opens a part in the Windchill web portal, but the actual attribute edit happens inside a canvas-rendered grid. Save the change, and it may trigger a callback into the Java thick client for revision control. Nothing about that workflow lives entirely inside a browser tab.
What Selenium can and cannot see in that architecture
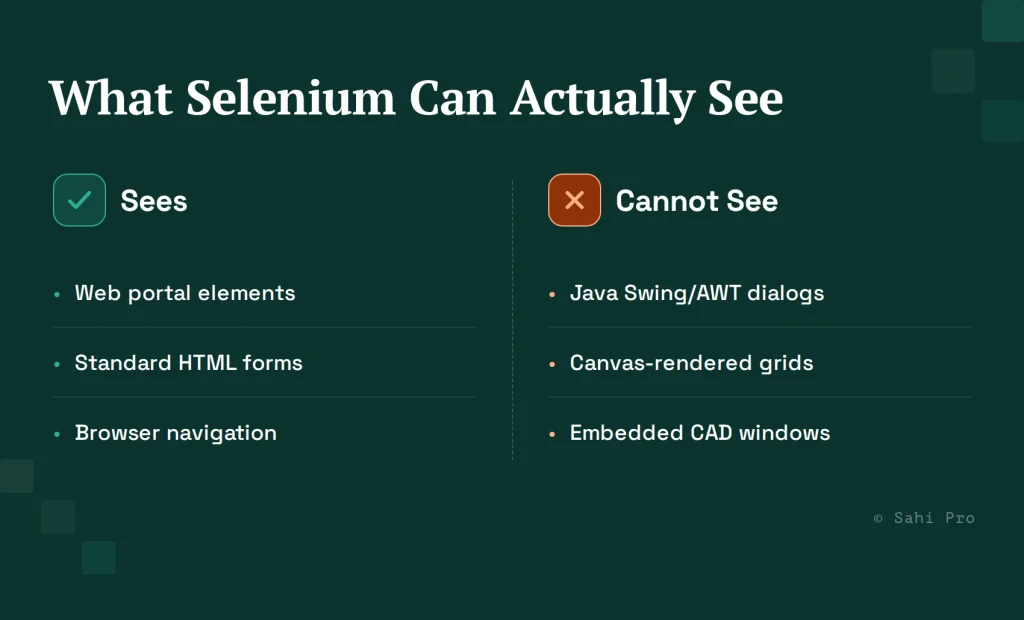
Selenium’s WebDriver protocol operates against the Document Object Model. It finds elements by XPath or CSS selector, and it can only find what the browser exposes as DOM nodes. A Java Swing dialog opened by Windchill’s Creo plugin is a separate native window. Selenium has no locator strategy for it, because there is no DOM to query.
The failure mode here is not a red test. It is a script that clicks past a step it cannot see, or a script that was never written to reach that step in the first place, because nobody flagged it as reachable. On a canvas-rendered Windchill attribute grid specifically, a standard locator-based approach cannot resolve individual cells at all, since the grid is painted as pixels rather than exposed as addressable elements. Teams evaluating Teamcenter-specific tools run into the same structural issue on the Java Rich Client side.
Why this produces a false sense of coverage, not a lack of effort
This is not a criticism of how the Selenium suite was built. A well-engineered Selenium suite can achieve genuinely high pass rates on everything it was designed to reach, the web portal, standard forms, navigation, and still never touch the Java client or canvas layer, because those layers sit outside what WebDriver was built to automate. Sahi Pro’s own comparison of the two approaches puts this plainly: Selenium relies on brittle, DOM-position locators and has no native path into non-browser layers, which is a different problem from having no automation at all.
The result is a report that says “passing” next to a defect log that says otherwise, and neither one is lying. They are measuring different things.
A practical way to check if this gap exists in your suite
Pull your last five to ten production defects or emergency hotfixes. For each one, ask a single question: did this occur in the web portal, in the Java thick client, or at an API or backend integration boundary? If a meaningful share of that list sits outside the web layer, your Selenium pass rate is not measuring the risk that actually reaches production. It is measuring the risk inside the one layer Selenium was built to see.
This costs an afternoon, not a tooling change, and it turns a vague suspicion into a specific, defensible finding you can bring to a QA lead or engineering manager.
What closes the gap without discarding the existing suite
The fix here is not “replace Selenium.” It is extending coverage to the layers Selenium was never architected to reach. Sahi Pro identifies elements by relational, proximity-based context rather than DOM position, which lets a single test flow move between the web portal, the Java Rich Client, and API calls without switching frameworks mid-script. For the canvas-rendered layer specifically, AI Assist uses image recognition to read attribute grids and CAD plugin windows the way a person would, since there is no DOM node to target.
Teams that have made this move are not usually starting from zero. They are extending an existing regression practice into the layers it never had visibility into. Sahi Pro’s own comparison against Selenium puts the resulting number plainly: an 80% reduction in test maintenance versus conventional tools, once cross-layer coverage replaces a patchwork of workarounds.
Sources
- Sahi Pro vs Selenium
- Siemens Teamcenter Active Workspace and Java Rich Client architecture documentation (Siemens Digital Industries Software)
- PTC Windchill PDMLink and Creo integration documentation (PTC)
- Selenium WebDriver protocol documentation (Selenium project)